|
| Summary | Zusammenfassung |
| For interactive diagram creation using Python with
matplotlib, various packages exist (amongst them matplotlib itself), which are accessible via the matplotlib website. Matplotlib can be used inside of real, say,
Tkinter apps, but using the matplotlib API is slightly cumbersome and typing intensive. Adding "layers" as such is not supported, and changing properties of once created
drawing pathes is most easily achived by redrawing the whole diagram, creating huge programming overhead. I wanted to have a package simple to handle, wich is capable of maintaining diagram instances with layers, which are fully customisable to my need even after creation time. Here, this package is presented. It is very lightweight, and provides an API wich makes using diagrams in Tkinter applications as well as in a native interactive Python shell joyful. The API does not support each and every feature of matplotlib, because so far I had no need to plot more complicated things than simple line plots in various formats and colors, and sometimes a map plot of twodimensional array data either in the
jet or in the
gray colormap. Legends are not supported so far. The module adds to the extension modules for matplotlib, making the API easier to access in real-world applications. For instance, one can create in Tkinter programs an instance of a diagram, plus an instance of a renderer for the diagram and that's all to make the diagram be displayed in the app with the antialiasing quality of the
Agg backend shipped with matplotlib. There are unlimited many diagrams, and unlimited number of layers per diagram. Rendering supports EPS and image output via
PIL, if present (the EPS renderer comes with matplotlib and is always available). Myself I am using the package nearly every first or second day in my daily scientific work.
| Es existieren verschiedene Pakete zur interaktiven Diagrammerzeugung unter Python mit
matplotlib (unter diesen matplotlib selbst), welche über die matplotlib-Sebweite erreichbar sind. Matplotlib kann in richtigen, z.B.
Tkinter-Applikationen benutzt werden, aber die Benutzung der matplotlib-API ist leicht umständlich und tippintensiv. Das Hinzufügen von "Layern" als sochen ist nicht unterstützt, und die Änderung von Eigenschaften bereits erzeugter
Drawing Pathes wird am einfachsten darüber erreicht, daß man das ganze Diagramm neuzeichnet, was enormen Programmier-Overhead erzeugt. Ich wollte ein einfach zu handhabendes Paket haben, welches in der Lage ist, Diagramm-Instanzen zu unterhalten mit Layern, welche selbst nach dem Erzeugungszeitpunkt meinen Bedürfnissen entsprechend voll anpassbar sind. Hier wird dieses Paket präsentiert. Es ist sehr leichtgewichtig, und stellt eine API bereit, welche Diagrammerzeugung sowohl in Tkinter-Applikationen als auch in der reinen Python-Shell erfreulich macht. Die API unterstützt nicht jedes Feature von matplotlib, weil ich bis jetzt nicht kompliziertere Dinge plotten mußte als einfache Linien-Plots in verschiedenen Formaten und Farben, sowie ab und zu einen Kartenplot von zweidimensionalen Array-Daten entweder in der
jet- oder in der
gray-Colormap. Legenden werden so weit nicht unterstützt. Das Modul erweitert die Zusatzmodule für matplotlib, und macht dabei in real-World-Programmen die API leichter zu benutzen. Man kann z.B. in einem Tkinter-Programm eine Instanz eines Diagramms erzeugen, sowie eine Instanz eines Renderers für das Diagramm, und das ist alles um das Diagramm mit der kantenglättenden Qualität des
Agg-Backends, welches mit matplotlib ausgeliefert wird, anzuzeigen. Es können beliebig viele Diagramme erzeugt werden, und eine beliebige Anzahl von Layern pro Diagramm. Das Rendering unterstützt EPS sowie via
PIL, falls vorhanden, auch Bildausgabe (der EPS-Renderer kommt mit matplotlib und ist immer verfügbar). Ich selbst benutze das Paket naherzu jeden ersten oder zweiten Tag in meiner täglichen wissenschaftlichen Arbeit.
|
| Examples | Beispiele 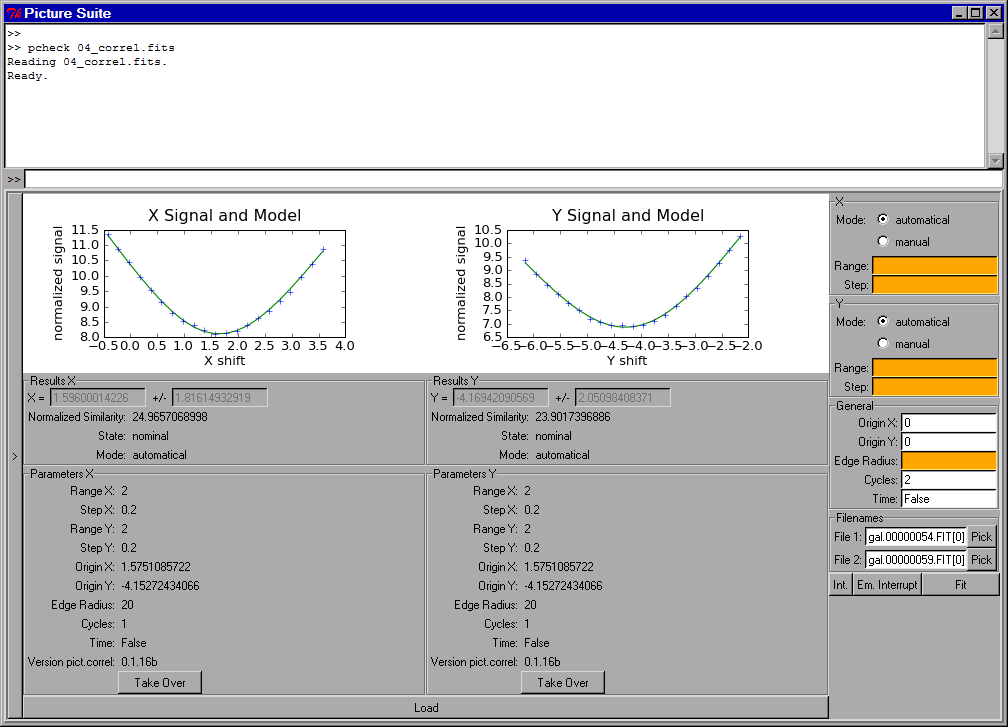
|
| diagram_cl in action in a program | diagram_cl in Aktion in einem Programm 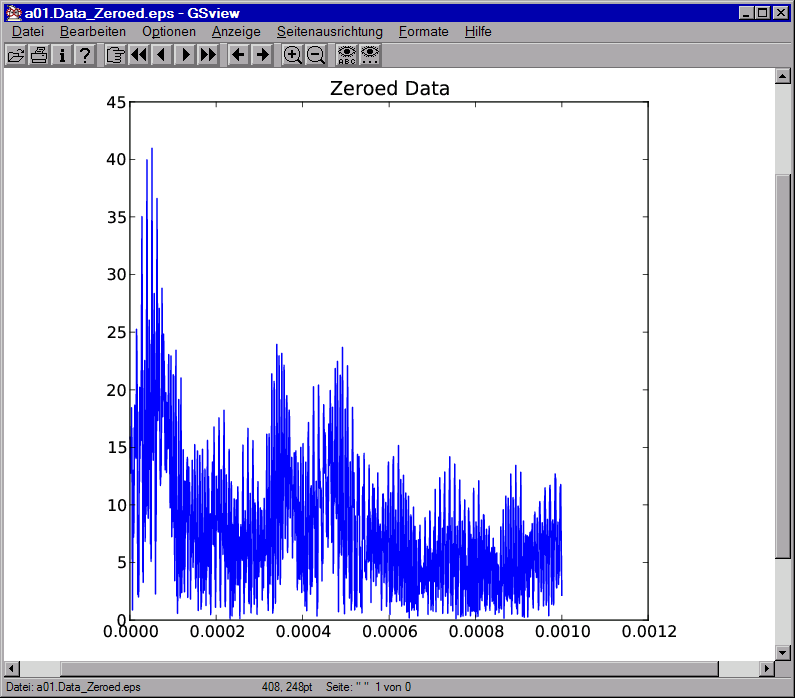
|
| EPS file output with diagram_cl | EPS-Dateiausgabe mit diagram_cl Maintained since: 9/09
$Last changed: 10/09$